


Background of this index
As 2025 draws to a close, it feels like an inflection point. AI has moved from experimentation to execution, quietly starting to “eat business processes” like how software started to eat the world more than a decade ago.
What was once experimental is now operational, increasingly appearing as an unplanned but potentially material expense for businesses. Yet actual usage still lags intent. Recent RBA research shows that while around 70% of mid-to-large firms in Australia report adopting AI, only 20% see moderate usage and fewer than 10% report significant usage. Our own True State of AI in Finance report reflected a similar gap: 55% piloting AI, but only 15% embedding it into finance workflows.
This lag is typical of emerging technologies, but the direction of travel is unmistakable - Australian businesses are leaning forward.
Against this backdrop, we saw an opportunity to contribute to the public discourse, not just as a SaaS solution vendor, but as stewards of a unique dataset. With thousands of companies transacting a billion dollars through Weel each year, we can complement intent surveys with real evidence of what businesses are actually buying. This index captures this once-in-a-lifetime shift as it unfolds.
Why weel’s data matters
Australia has no shortage of AI commentary, but very little of it is anchored in actual transaction-level activity. Globally, however, we’ve seen our counterpart Ramp create a similar index.
Additionally, our vantage point comes from working predominantly with small and medium-sized businesses (in contrast to the RBA research aforementioned). We believe the SMB segment is most likely to actually use AI tools as soon as they pay for them. Unlike larger orgs, where they’ll invest early and take time to actually adopt. This means transactional indicators are great indicators to infer actual usage.
The dataset includes over 3,500 Australian companies, fully anonymised and aggregated, covering the period from Jan 2023 to Oct 2025. AI adoption is inferred from positive monthly spend on identifiable AI services, with industry classification applied via internal taxonomies.
Importantly, this analysis excludes Google Gemini and Microsoft CoPilot, as their AI features are bundled within broader subscription suites, making discrete usage impossible to isolate.
Author’s note: The methodology mirrors prior work I pioneered at Pocketbook, and then Zip, where consumer spending indices revealed macro shifts months ahead of official data. This spending series was pivotal to navigating Australia’s consumer spending habits during the COVID-19 lockdowns.
Snapshot of findings
1. Australia lags the US in adoption rates
Comparable data from the US shows that over 40% of companies have adopted paid AI tools. Australia, by contrast, sits at 21.7%, though the penetration is significant - up from 2.7% in Jan 2023, with roughly a 30% increase since Jan 2025 alone. Despite the gap, the underlying trajectory mirrors the US: fast and accelerating.
By contrast, the usage does lag behind bigger Australian companies, where around 70% are spending, but only around 30% are using at a moderate or significant rate according to the RBA research. For the SMB cohort, we believe this 21.7% would be more indicative of actual moderate to significant use.

2. industry leaders mirror global trends
The industry ranking is broadly consistent with international patterns. Note that we have applied industry-specific classification from April 2024 only.
Technology and Financial Services continue to act as early adopters, while Manufacturing comes in third, similar to the US Ramp equivalent.

3. chatgpt dominates against other AI models
Among the AI Models used, adoption is highly concentrated. Additionally, the long tail includes various specialist AI tools, but none approach the ubiquity of ChatGPT in day-to-day operational workflows.
- ChatGPT: 19.3% of companies
- Anthropic: 3.8% of companies

Note that Google Gemini and Microsoft Co-Pilot are not included in this research, as previously stated.
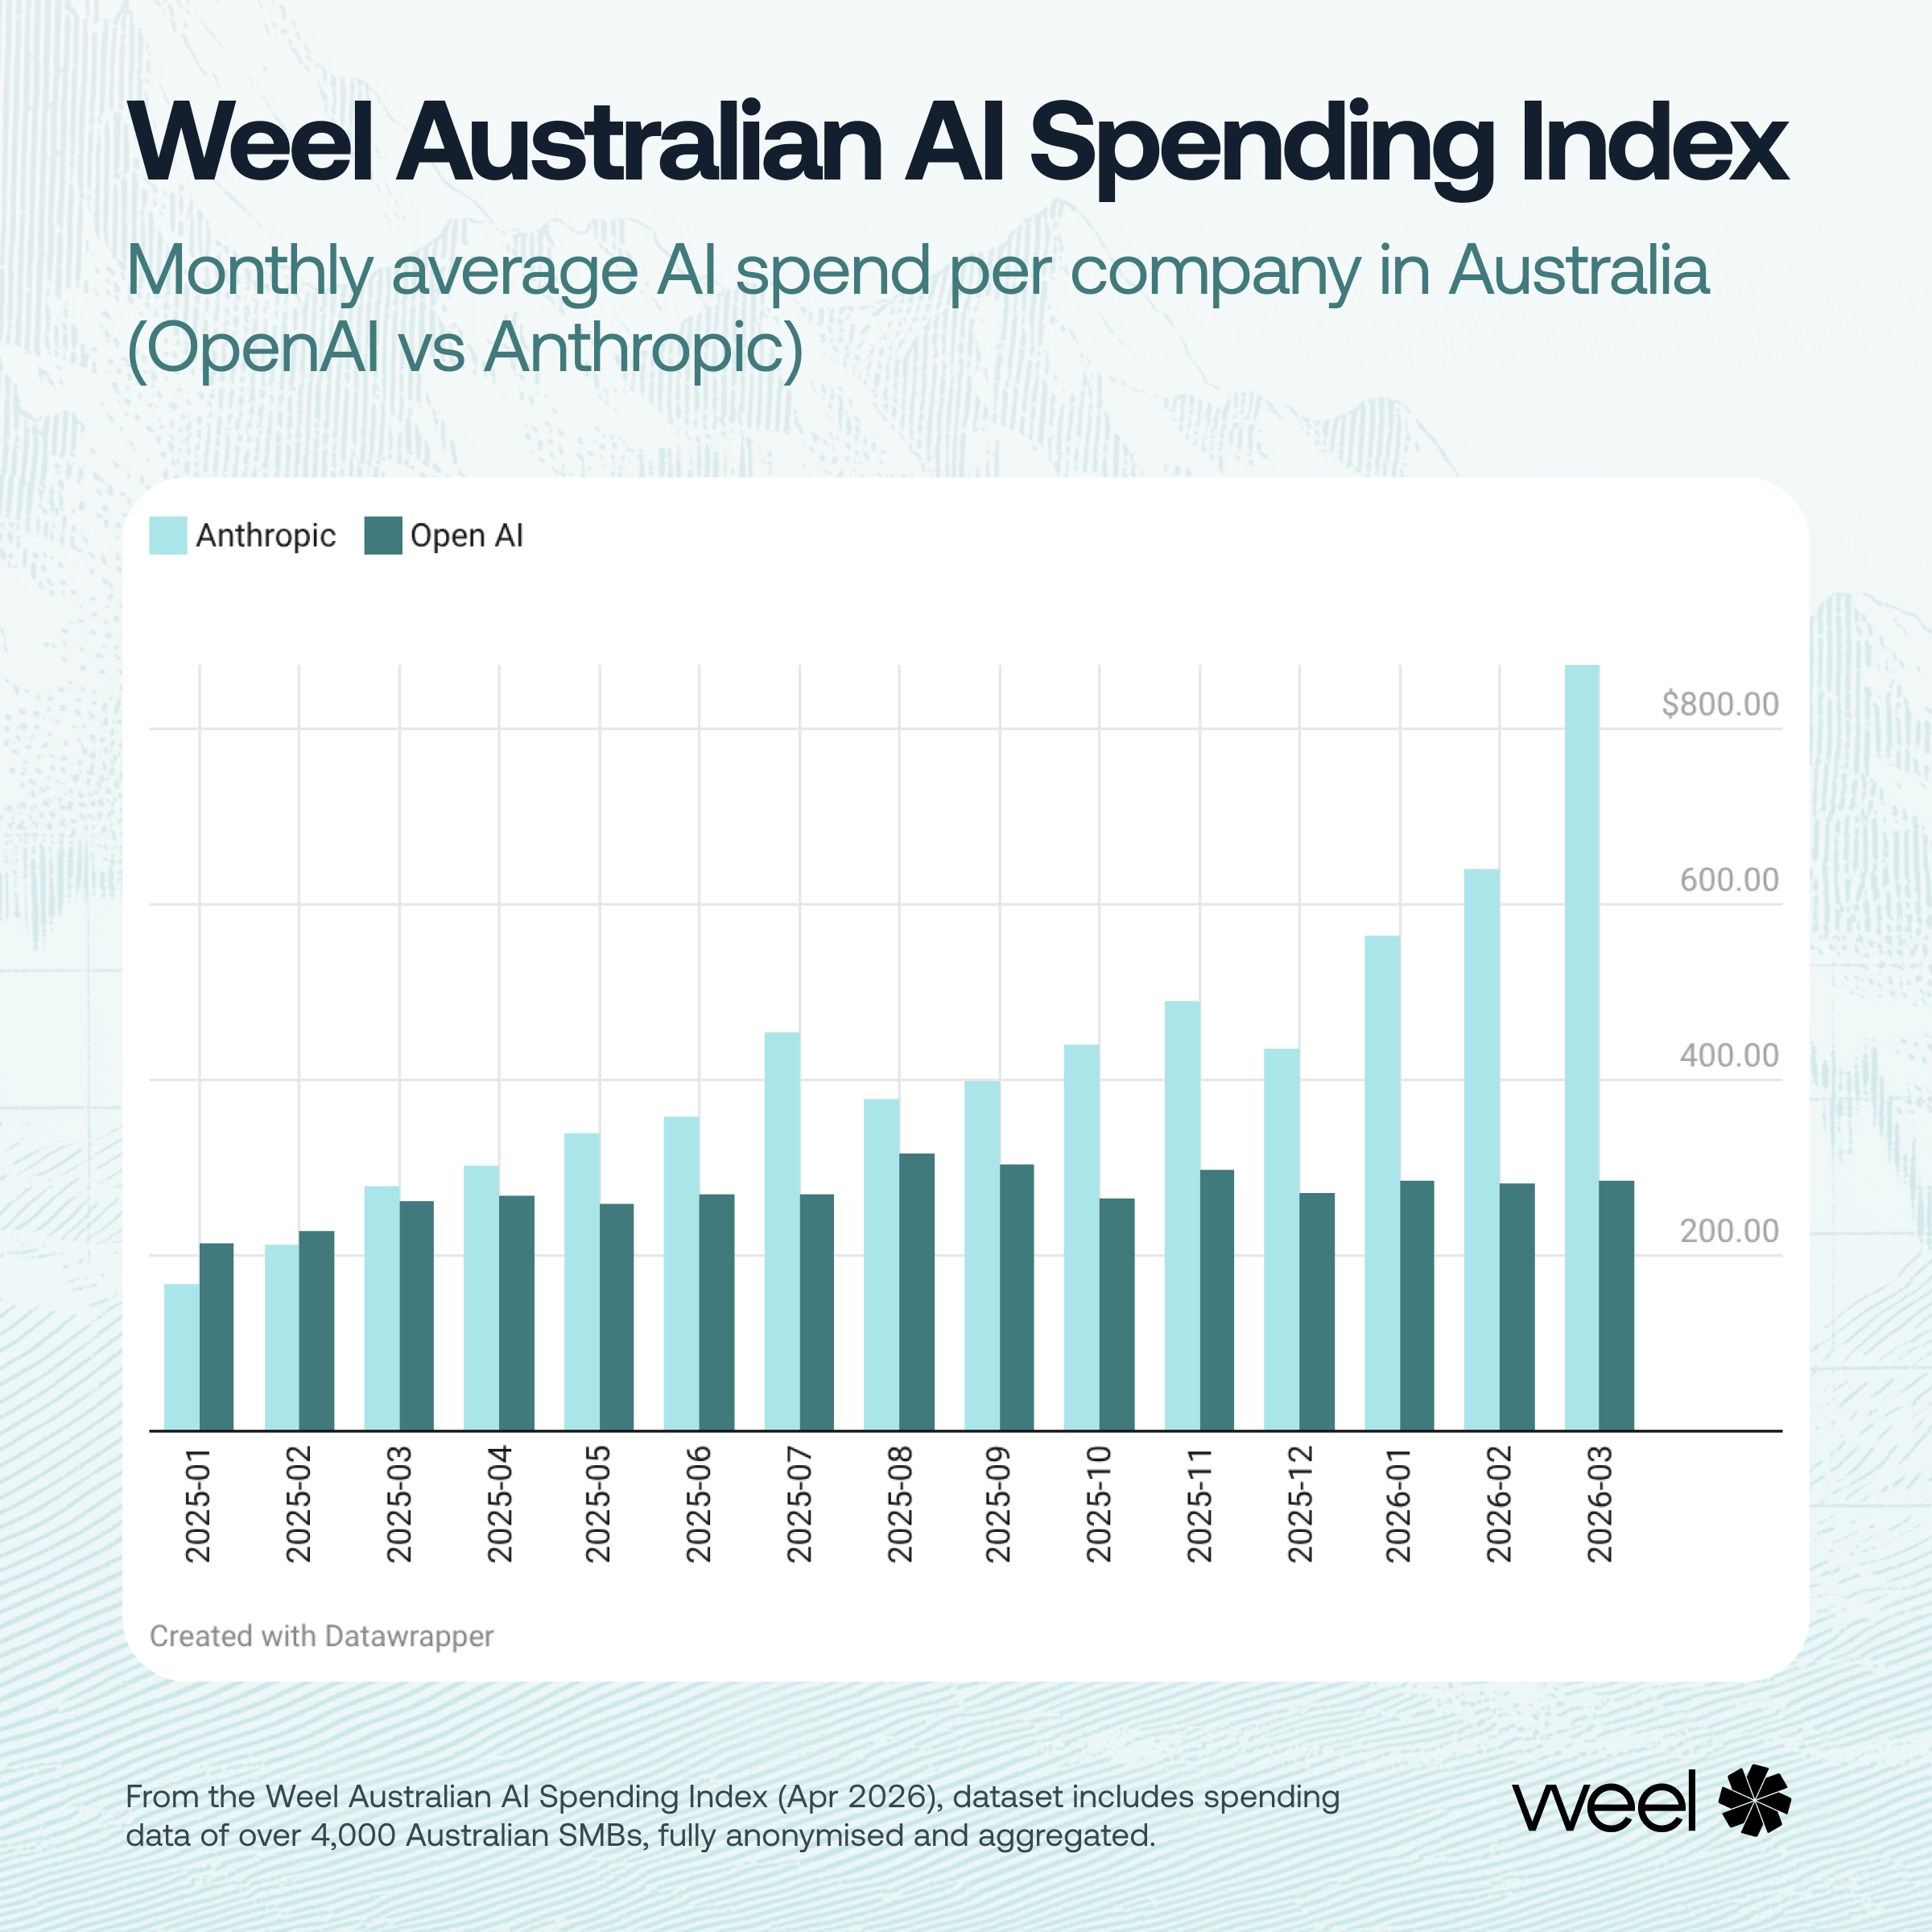
4. average monthly AI spend by industry is rising sharply
Across most industries, average monthly AI spend per company has grown substantially in the last year, with monthly spend roughly doubling in both the Technology and Financial Services sectors.
- Financial Services: 53.7% growth
- Technology: 101.9% growth
- Manufacturing: 27.6% growth
- Cross-Industry Average: 33.8% growth
Interestingly, the Not-for-profit sector showed a 29.1% decline in average monthly AI spend. This likely reflects the cash-constrained nature of these organisations as we move into the long tail. Notably, the share of Not-for-profits' spending on AI still increased substantially - from 6.3% in Apr 2024 to 21.1% in Oct 2025.

Opportunities for future research
This index represents an early view of a fast-moving landscape. Several expansions are already planned:
1. incorporating Microsoft and Google AI usage
As previously mentioned, Co-Pilot and Gemini are embedded in broader enterprise subscriptions, making it difficult to infer which businesses are actively using AI vs simply paying for bundled licenses. Untangling this is a key next step.
2. extending sector-specific analysis
Future releases aim to break down spending patterns within sub-industries (e.g., fintech vs traditional financial services; software vs hardware tech companies).
3. tracking tool switching and multi-ai stacks
As businesses diversify beyond a single AI platform, patterns of tool-stack evolution will be increasingly important. Specialised tools, trial alternatives, and switching vendors will become evident as capabilities mature. Understanding these patterns - what gets adopted, dropped, or consolidated - will be key to anticipating where AI spending is actually heading.
4. comparing adoption by company size
Future analysis should compare the sample based on organisation size buckets to reveal further variation in behaviour.
Limitations of the data
To make this research meaningful, we want to be as open as possible about the sample limitations. These are:
- Company size representation: Data reflects Australian companies using Weel, which may be biased toward SME adoption patterns.
- Scope: This index should be interpreted as a leading indicator, not a comprehensive measurement of the entire economy.
- Coverage window: Analysis spans January 2023 - October 2025, and April 2024 - October 2025 for industry categorised data.
- Exclusion of bundled AI services: Microsoft Co-Pilot and Google Gemini cannot currently be isolated from broader subscription SKUs.
Stay updated
This index will be updated quarterly as adoption accelerates and the dataset expands. The next scheduled coverage will be in Q1 2026.
For other deeper analyses and upcoming reports from the Weel Data Research series, please subscribe to our newsletter.

.png)