






The Weel Australian AI Spending Index tracks how many businesses across Australia and New Zealand pay for AI tools, and which providers, drawn from anonymised expense data across 4,000+ companies on Weel. It's a ground-level read on real subscriptions here, not a survey of intentions. Every figure in this index is Australian and New Zealand data; where we cite global or US numbers for context, we flag them as such.
Last quarter we reported that the share of businesses paying for Anthropic, the maker of the Claude models, had climbed to 10.2% by March, still behind OpenAI (the maker of ChatGPT) but rising fast. We left two questions open: would Anthropic's run keep going or plateau, and would the longer term AI-up, SaaS-down crossover we flagged hold through the second quarter?
Through Q2, both answers came back the same way. Anthropic kept climbing to 17.0% and is now within touching distance of OpenAI, the base of businesses paying only for OpenAI shrank sharply as businesses added Anthropic, some alongside OpenAI and some in its place, the spend gap between the two widened, and the SaaS crossover held. Overall AI adoption broke 30% for the first time. Here's what the data shows.
This update covers the second quarter of 2026, April through June, picking up from our March data. All figures are anonymised and aggregated across 4,000+ Australian and New Zealand SMBs using Weel: percentages are the share of those businesses paying, and dollar figures are average monthly spend per paying business.
1. Adoption broke 30% for the first time
AI adoption among Australian and New Zealand SMBs reached 30.8% in June, up from the 27.5% we reported in March and 22.1% in January, crossing 30% for the first time in the history of the index.
That's an 8.7 percentage point gain since January. For context, it took the entire calendar year of 2024 to move roughly five points, from 10% to 15%. We've now added nearly double that in less than half the time.
2. The surge became a switch
This is the story of the quarter, and it answers the first question we left open last time: Anthropic's run did not plateau.
- Anthropic went from 10.2% in March to 13.9% (Apr), 15.6% (May) and 17.0% in June. Back in January it was 5.4%, so it has more than tripled across the year.
- OpenAI held roughly flat: 19.6% in March, then steady around 19% to 20% through to 19.0% in June.
In January, OpenAI led Anthropic by more than 13 points. By June, that lead had narrowed to two (19.0% vs 17.0%). OpenAI hasn't shrunk in our data; it has held steady while Anthropic has done most of the running. On the current trajectory the two are on course to cross, and among US businesses it already has: comparable US spending data recorded Anthropic overtaking OpenAI in April 2026. Australia and New Zealand look to be a step or two behind on the same path.
This lines up with the global picture. Menlo Ventures' enterprise LLM data now puts Anthropic at 40% of enterprise model spend, up from 24% a year earlier, while OpenAI has slipped from 50% in 2023 to 27%. Enterprise buyers have come to prefer Anthropic's models over any other provider's, and by early 2026 Anthropic had overtaken OpenAI on annualised revenue run-rate. What we're seeing in Australian and New Zealand SMB card data is the same shift, showing up in the accounts of small businesses rather than in enterprise API contracts.
3. It's genuine migration, not just new adopters picking a different horse
The easy explanation would be that new adopters are choosing Anthropic while existing OpenAI customers stay put. The data says otherwise.
Look at how the AI-adopting base splits by provider:
- OpenAI only fell from 78.4% of the base in January to 37.5% in June.
- Anthropic only climbed from 7.1% to 30.3%.
- Both rose from 14.5% to 32.2%.
A near-monopoly at the start of the year is now close to a three-way split. Some of that is diversification, businesses adding Anthropic alongside OpenAI rather than replacing it. But a lot of it is genuine switching, and our net-flow measure confirms it.
Through all of 2025, net movement between the two ran slightly toward OpenAI, month after month. In 2026 it flipped and stayed flipped, turning positive in January and running firmly toward Anthropic from March onward. This is the cleanest evidence we have that we're watching a switch, not just a wider menu. Money is moving, not only arriving.
4. The real headline is spend, not share
Share of companies is the obvious metric. The one that made us sit up is average spend per company, because it points to how deeply these tools are being used.
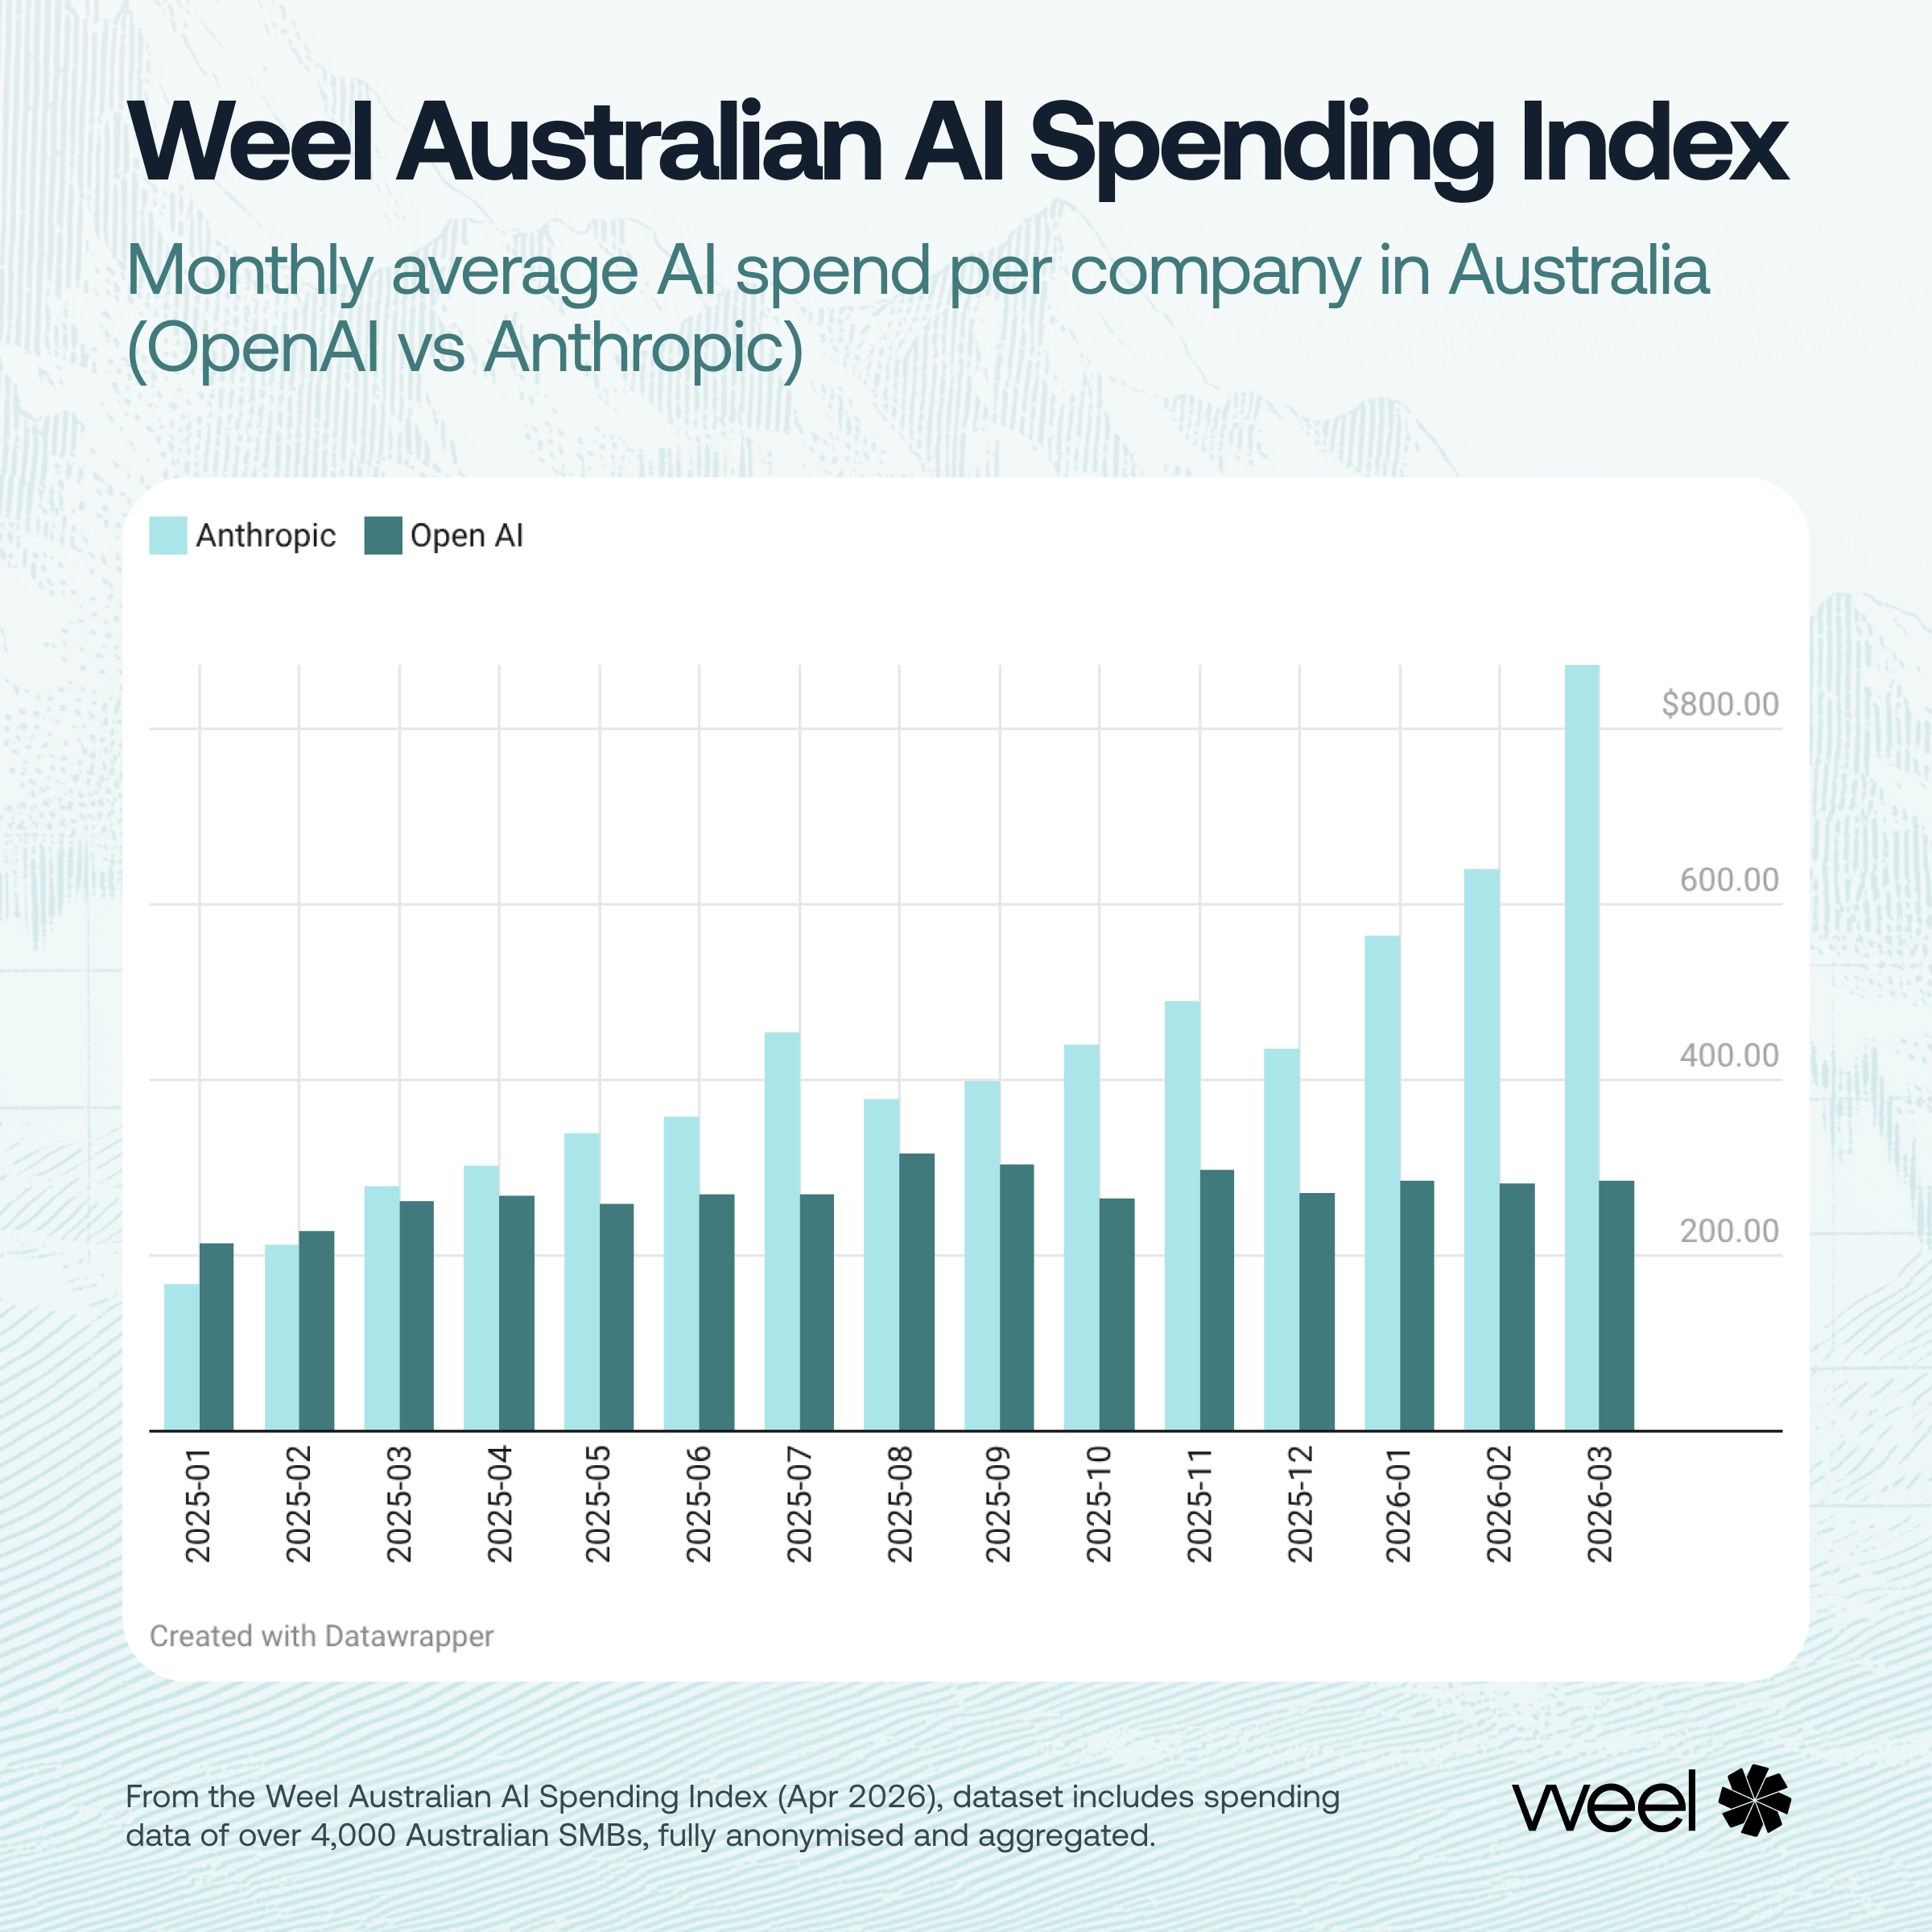
In January 2025, the average OpenAI customer outspent the average Anthropic customer ($215 vs $168 a month). The lines crossed around March 2025 and then diverged sharply. By March 2026 the average Anthropic customer was spending $873 a month to OpenAI's $286; by June that had stretched to $1,082 versus $298. Anthropic customers now spend roughly 3.6 times as much, and the gap is still widening.
That divergence is a usage signal. Flat OpenAI spend looks like per-seat subscriptions, a fixed cost that doesn't move much once it's set. Anthropic's climb looks like consumption that scales with work done, which is exactly what you'd expect from coding and agent workloads that bill by how hard they're run. Through mid-2026 both providers have leaned into that divide, with Anthropic pushing further into metered, usage-based pricing while OpenAI keeps more of its value in flat subscriptions. It fits the external picture: Anthropic reported a revenue run rate of around $47 billion by May 2026, up from about $9 billion at the end of 2025, with Claude Code alone reaching a run rate of more than $2.5 billion and enterprises making up close to 80% of revenue. Our SMB data is the small-business echo of that. Fewer Australian and New Zealand businesses are on Anthropic than on OpenAI, but each one is spending far more, and spending more every month.
5. The SaaS crossover held
Last quarter's headline was that AI had started eating software. The second question we left open was whether that crossover would hold through Q2. It did.
AI adoption has nearly tripled since early 2024. Over the same stretch, the share of businesses paying the top 20 SaaS (subscription software) companies has drifted down from the mid-40s to 41.6% in June, its lowest in the series and down again from the 42.7% we reported in March, just as AI hit its highest. The two lines are still far apart, but they've been converging for 18 months, and the direction hasn't wavered.
The public markets priced in the same fear, harder. We flagged the SaaSpocalypse last quarter, and through Q2 the repricing continued: a JPMorgan analysis put it at software's largest non-recessionary drawdown in more than 30 years, roughly $2 trillion off the sector's peak, as investors bet that AI agents would erode the per-seat licensing model. A single April session saw Cloudflare, Snowflake, ServiceNow and Salesforce fall together. But this is a story still in motion, not a settled verdict: the selloff was driven by sentiment and valuation rather than falling earnings, and the market has since split, with several of those same names recovering or growing as they leaned into agentic and consumption pricing (Salesforce's Agentforce, HubSpot's usage credits, Snowflake), while pure per-seat models stayed under pressure. Other US spending data cautions that reports of SaaS's death are overstated, with seat-based contracts still the large majority of software spend. Our own read is narrower: in the same businesses, at the same time, we can see AI climbing while SaaS penetration slips. We won't claim one is causing the other, but they are clearly moving together.
6. Technology joins Financial Services above 50%
Last quarter Financial Services had already pushed past the halfway mark, reaching 53.3% in March. This quarter Technology joined it, rebounding from 48.9% to 50.3% in June, so the two adoption leaders now sit side by side above 50%, with Financial Services at 52.9%.
Behind them, Manufacturing reached 42.9% and Education surged to 37.3%, up from 28.5% in March and one of the fastest movers in the dataset.
Zoom into the two leaders and the same substitution pattern gets sharper.
In late 2022, both sectors ran SaaS penetration around 90% while barely touching AI. Since then the two lines have moved hard toward each other. In Technology, SaaS penetration has fallen from about 90% to 60% while AI has climbed from 15% to 50%. In Financial Services, SaaS has slipped from 92% to 64% while AI has surged from 6% to 53%. The gap between software and AI spend inside these sectors has closed from roughly 80 points to about 10. Where the whole-market SaaS line erodes gently, inside the two sectors leading AI adoption it is falling fast, and AI is climbing to meet it.
What we're watching
Does OpenAI hold its floor, or does Anthropic overtake it outright? OpenAI has been flat, not falling, for six straight months, and its enterprise business is still growing quickly on other measures. This is not a foregone conclusion: a strong model release or a pricing move from OpenAI could reaccelerate it, and the race is far from settled. If Anthropic keeps its current slope, the crossover in our data happens before the next update; if OpenAI reaccelerates, this stays a genuine two-horse race.
Does the spend gap keep widening? A 3.6x spend advantage that's still growing is the most important number in this report. If it holds, it reshapes what "market share" even means, because a business counted once on each side is not spending the same money on each side.
Is multi-model now the default? With "both" at 32% and climbing, single-provider setups may soon be the minority. That has real implications for how SMBs budget, procure and govern AI.
The blind spots are unchanged. We still can't isolate Microsoft Copilot or Google Gemini from bundled subscription SKUs, so their true footprint sits outside this index. Read the model-level numbers as the direct-spend picture, not the whole market.
Limitations (Unchanged)
Same caveats as every prior release, restated for transparency:
- Company size: the data reflects Australian and New Zealand businesses using Weel, biased toward SME spending patterns.
- Scope: this is a leading indicator, not a comprehensive economic measurement.
- Coverage window: the series now spans late 2022 to June 2026.
- Bundled AI: Microsoft Copilot and Google Gemini can't currently be separated from broader subscription SKUs.
Stay updated
We publish this index quarterly as adoption accelerates and the dataset grows. Last quarter we asked whether Anthropic's run would hold and whether the SaaS crossover would stick. This quarter both did. The next update will tell us whether OpenAI holds the line or Anthropic completes the crossover.
For future analyses and upcoming reports from the Weel Data Research series, please subscribe to our newsletter.